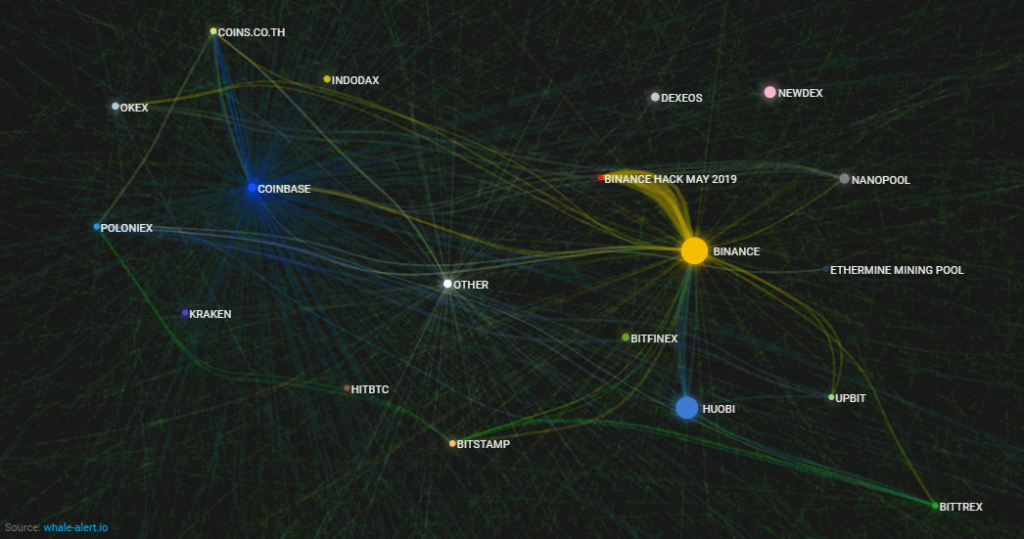
Block chain is considered to be anonymous. Although tracking of those anonymous transactions is really easy. Here is nice visualization made by WhaleAlert. It illustrates the live transaction flow at the moment:
This live view is just illustrating current transactions between different parties. Stronger the line is, bigger transaction is made. Creating this kind of illustrations can reveal interesting facts about market movements. Where tokens are flowing and how known counter parties or market places are behaving.
Illustration can also nicely reveal mallicious activities like in this picture from WhaleAlert. It is showing how Binance Hack May 2019 was visible in transactions.

Transactions moving within the block chain can often remain anonymous. Some accounts have been marked based on their known misbehavior. Owners of some are know other way. Like known counter parties in earlier transactions.
At the end of the day, when assets are consumed, they move outside the individual accounts in block chain to traditional financial institutions or established crypto market places. As they have to know their customers anonymity starts to fade away. This creates interesting opportunity to observe openly value transfers between parties. In future this kind of openness could maybe give an upper hand for crypto at least against traditional cash payments. Interesting to see how this develops and what are the potential ways to utilize capabilities of AI in this arena.
